Get the right experience for you. Please select your location and investor type.
IMPORTANT NEWS: Transition of investment management responsibilities (excluding the Worldwide strategies)
First Sentier Group, the global asset management organisation, has announced a strategic transition of Stewart Investors' investment management responsibilities to its affiliate investment team, FSSA Investment Managers, effective Friday, 14 November close of business EST.

Letter to Investors
Stewart Investors Worldwide Leaders Strategy
Thank you for your trust.
We try to do three things consistently
- Remain true to our investment philosophy at all times
- Foster a culture of excellence through a constant appraisal of our abilities
- Nurture a quality investment management business with an intergenerational stewardship mindset
These are key for us to deliver sound long-term returns. We strive to remain sober and frame our investment thinking over 10-year time frames. Paying a reasonable price for quality companies that profitably solve developmental challenges remains the bedrock of our investment approach.
What are we grappling with?
Edward Lorenz, a famous mathematician, put forward the Chaos Theory in 1961. The underlying premise is that small changes in initial conditions can lead to a wide variety of outcomes. His discovery explains the popularly understood butterfly effect. Now combine this with the law of unintended consequences. Then the idea that the more things change, the more they stay the same. We live in a world of constant news flow, technology arms race, strong man politicians, climate change and a shifting economic and geopolitical set up. Making strong predictions in this context is fashionable but risky. Hence, we grapple with questions that matter over our time frames and try and change our minds quickly where possible.
Covid is a distant memory but a good example of the butterfly effect. No living investor then had invested through a pandemic. We started speculating about how the world might change permanently and the implications for our companies. Thankfully common sense prevailed. We allocated more capital to quality companies at cheaper prices. The investment logic – if the best franchises and cultures cannot survive and evolve through a pandemic, who can? Moderna’s (covid vaccines) and Zoom’s (video conferencing tool) share prices are now back to where they were in March 2020.
“I will immediately…overhaul the trade system to protect American workers and families. Instead of taxing our citizens to enrich other countries, we will tax and tariff foreign countries to enrich our citizens.”
– Donald Trump1
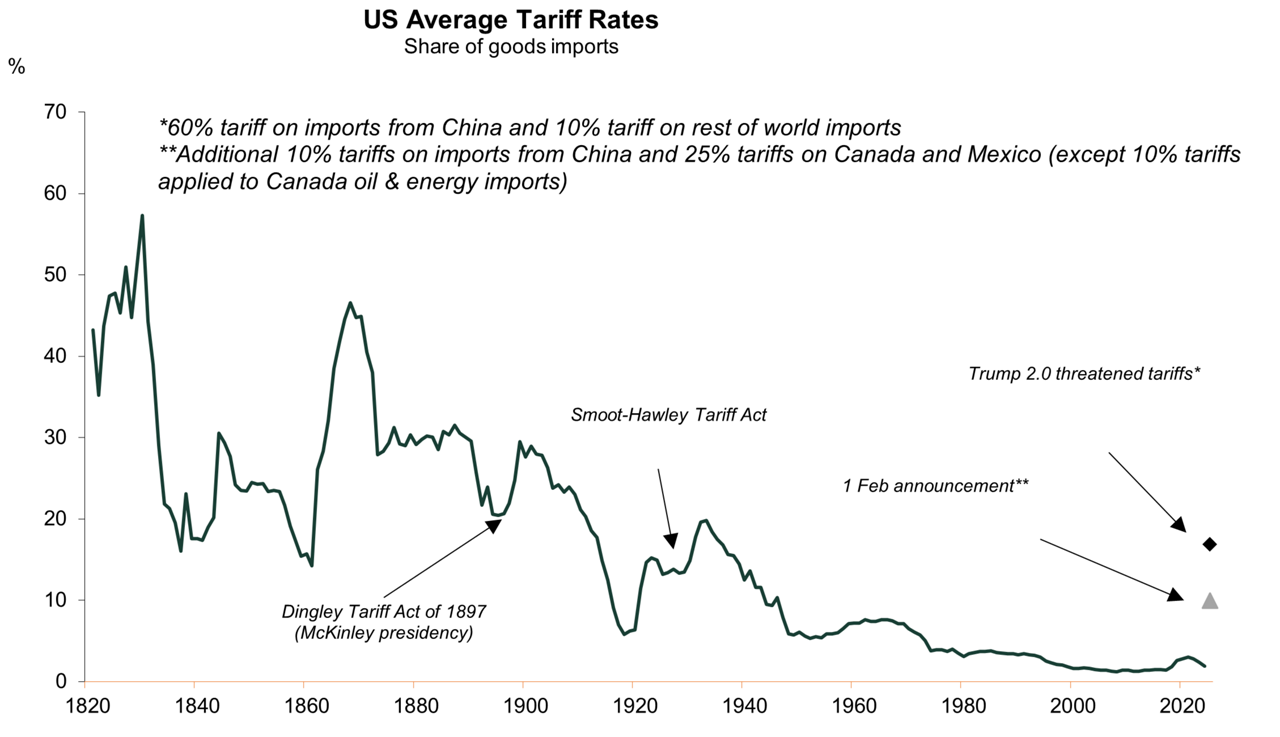
The world’s economic set up is undergoing a seismic shift. How countries and companies respond to the changes being unleashed by tariff wars, technology arms race, and rising geopolitical risks will be interesting. History may hold some clues. Trump reminisces about the strength of the US in the late 1800s when tariffs were high and the US experienced “The Great Deflation” post the American Civil war. This period was marked by high growth, deflation and rise in productivity and real wages. Thanks mainly to the industrial revolution. This wasn’t a normal economic cycle. Then came the McKinley tariffs of 1890. McKinley’s primary aim was to protect a flourishing US economy from foreign competition. This resulted in a sudden spike in inflation and led to America’s first, albeit short lived, depression called the Panic of 1893. McKinley is popularly referred to as the “Napoleon of tariffs”.
But that was a different world. We are now in the 21st century. Different starting points, different actors and a different business and geopolitical reality.
The global economy today is a complex interconnected beast. Information and capital moves freely across borders. This has allowed American companies to build large global businesses in the last 4 decades. 8 of the top 10 and 24 of the top 30 companies by market capitalization globally are American businesses2.
| Index | Proxy | Share of U.S. Sales | Share of Foreign Sales |
|---|---|---|---|
| Russell 2000 | iShares Russell 2000 ETF | 77% | 23% |
| S&P 500 Equal-Weighted | -- | 69% | 31% |
| S&P 500 | -- | 59% | 41% |
US GDP is roughly one quarter of the world GDP3. Sizeable but the US has to do business with the remaining three quarters of the world’s GDP. The rest of the world is a larger market for American companies. On the other hand, the US still has amongst the lowest average tariffs globally4. A dealmaker would sense an opportunity here but overplaying your hand can cause trouble.
Global supply chains will go through a complex, expensive and time-consuming phase of adjustment to tariff barriers and rising restrictions on free movement of labour. Costs should rise for businesses and their first response will be to pass this on to consumers. America’s GDP is driven mainly by household consumption - roughly USD 18 trillion dollars of annual consumption value5. Many of these consumption goods are imported. The desire to localize manufacturing at a tariff neutral cost structure will take time. The more immediate impact should be sticky inflation6. Many countries, including the US, could be vulnerable.
The race to find Mackenna’s AI gold7
Meanwhile, Artificial Intelligence (AI) is fuelling a technology arms race between companies and countries. The current AI investment frenzy is reminiscent of the California Gold Rush. A little more than USD 200 bn was spent on AI related capex in 2024 and another USD 300 bn announced for 20258. This does not include the billions of dollars in VC money flowing into AI related start-ups. The large spenders are mostly the Magnificent 79 (Mag 7) companies. These companies spent much of the last two decades without competing with each other and with minimal capital investment. Their paths are now colliding in this pursuit of AI supremacy. The scale of investments suggests this is not just a race for AI dominance but potentially a race for their own survival. And they are all cashed up with little choice but to outspend each other. Interesting times ahead! The future looks more risky than the past for these magnificent businesses.
Early in 2025, President Trump announced a new USD 500 bn investment in the Stargate AI project. This was promptly followed by the launch of DeepSeek, a Chinese AI engine built at a fraction of the cost of its American peers. The capital rush and hype has even drawn in governments, muddying the cost structures of participating entities. The industry might have to go through a cycle of destruction and re-birth before clarity emerges. The cardinal rule of any industry flooded with excess capital.
AI has dominated headlines, and we are aware of the pitfalls of getting sucked into this news flow. Remember Blockchain? The usual Caveat Emptor10 applies - Tech czars regularly hype up their investments and ideas. Social media gives them convenient loudspeakers to amplify their views. Everyone is vying for the top spot in the tech genius sweepstakes. There is much self-interest and egos at work here. Investors should be careful to avoid becoming collateral damage.
“The way this works is we’re going to tell you, it’s totally hopeless to compete with us on training foundation models and you shouldn’t try.”
– Sam Altman, founder of Open AI to Indian tech CEOs and entrepreneurs in 2023.11
Is America entering its “golden age” or are we firmly in the modern “Tech Gilded age”? Just the front rows in Trump’s inauguration ceremony were worth roughly USD 1.4 trillion dollars12. Business and politics have always mixed with each other. Lots happened behind closed doors. But the open camaraderie between centibillionaires and politicians, and the world’s richest man being employed by the government while actively seeking to do business with the government is new territory for the current generation of investors. The accepted norms of conduct for lawmakers and corporates are changing rapidly in the US. Global leaders are possibly taking notes. In a different era or in a different country such events would be reasonable cause for alarm. But the investment world is firmly in the grip of American exceptionalism. More than three quarters of the MSCI World Equity Index is indexed to USD assets13 and within that, the concentration at the top, represented by many of those front row occupants, has never been higher.
Globalization, geopolitical stability and low inflation were the three musketeers that powered the world economy over the last few decades. The year 2022 possibly marked the peak for these conditions. Experiencing all these together again might be a distant reality. We are now in unchartered territory and choppy waters. The quality of companies we invest your capital in has to be sturdier than ever to navigate these conditions.
Reflections on strategy performance
The strategy returned 8.8% and 65.6% over 3 and 5 years, respectively, compared to the index returns of 18.9% and 65.3% over the same periods, on a gross basis in USD terms. In 2024, the performance of the strategy increased by 10.9%, compared to index returns of 18.0%. Performance is unsatisfactory in relative terms. Resource driven markets in 2022 and the consistent outperformance of Mag 7 companies, which we do not own, were key reasons. We struggle with the quality of the Mag 7 companies other than Microsoft.
| Discrete annual performance USD – composite performance % | 12 months to 31-Dec-20 | 12 months to 31-Dec-21 |
12 months to 31-Dec-22 |
12 months to 31-Dec-23 |
12 months to 31-Dec-24 |
|---|---|---|---|---|---|
| Stewart Investors Worldwide Leaders (Gross of fees) | 23.5% | 23.3% | -21.5% | 24.9% | 10.9% |
| Stewart Investors Worldwide Leaders (Net of fees) |
22.9% | 22.7% | -21.8% | 24.4% | 10.4% |
| MSCI AC World Index (Gross of fees) | 16.8% | 19.0% | -18.0% | 22.8% | 18.0% |
| Annualised performance over periods USD – composite performance % |
Since launch | 10 years | 5 years | 3 years | 1 year |
|---|---|---|---|---|---|
| Stewart Investors Worldwide Leaders (Gross of fees) |
9.0% | 9.7% | 10.6% | 2.9% | 10.9% |
| Stewart Investors Worldwide Leaders (Net of fees) |
8.5% | 9.2% | 10.1% | 2.4% | 10.4% |
| MSCI AC World Index (Gross of fees) |
9.5% | 9.8% | 10.6% | 5.9% | 18.0% |
Returns are typically driven by a handful of companies in any index, but the scale of concentration driving index returns has been unprecedented recently. For instance, the equal weighted MSCI AC World index has returned -3.8% over three years and 20% over five years on a gross basis. One can see the significant gap opening between the equal weighted index and world index in recent years. We would never equal weight our portfolio so this comparison is only for illustration purposes to highlight index concentration.
MSCI ACWI vs ACWI Equal Weighted (USD)
Cumulative returns since 31 Oct 2013
We spend a lot of time analysing our mistakes. Losing money is harder to deal with than making a bit less on the way up. A 50% loss requires a 100% gain to break even but a 25% loss only requires a 33% gain. Capital preservation is a close friend of long-term compounding. The math checks out.
Natura and Philips remain our biggest mistakes over a five-year period. We sold out of these companies in 2023. We discussed them in detail in our previous letter. The fund’s largest detractors in 2024 were Samsung Electronics and DHL Group. These companies hurt performance by 1.3% and 1.2% respectively.
Samsung performed poorly as the company lagged in the memory tech cycle. Management have accepted this mistake and seek to correct it quickly. Meanwhile, the company’s balance sheet and long-term prospects remain sound. Samsung is now trading below its book value, which is quite cheap for the quality of the franchise and the investments they are making. They can invest mainly because of strong cash flows and the USD 71bn cash pile14. The key risk to returns is the difficulty in cracking the code to high manufacturing yields in foundry.
DHL Group is in the midst of a downcycle in logistics. Management is using this period to invest countercyclically and to buy shares back at cheap valuations. This is possible thanks to strong cashflows even in downcycles. DHL commands a 40%+ market share in global express shipments15 allowing it to earn attractive returns on its asset base. The table below shows DHL‘s share of operating profits in 2007 v 2024. Over this time, they have sold their financial services division and significantly grown DHL Express. DHL is a much stronger business today than it was in 2007 But this is not reflected in valuations. Spinning off the postal business should release significant value. We expect this to happen in the coming years. Shifting supply chains should also favour DHL given its large global footprint. The key risk is a complete collapse in global trade.
| Share of operating profits of DHL | 2007 | 2024 |
|---|---|---|
| DHL Express | 19% | 88% |
| Post & Parcel | 53% | 12% |
| Post Bank (Financial Services) | 28% | 0% |
The strongest contributors to returns over one and five years to the funds were Mahindra & Mahindra (M&M), Fortinet, Arista Networks, Costco and Watsco. These businesses continue to be well positioned for growth in the coming years. Other than M&M, all these businesses delivered negative returns in the year 2022, which hurt performance. M&M delivered negative returns in the years 2018 and 2019. We remained significantly invested in these businesses during these down years. The short-term volatility in returns is less important to us than the questions of whether the quality of the business remains intact. Often, when quality remains sound, this is an opportunity for us to add to excellent businesses at cheaper valuations.
| USD returns | First purchased | 1-year return | 5-year return | 2022 return |
|---|---|---|---|---|
| Mahindra & Mahindra | 2017 | 69.3 | 371.7 | 34.1 |
| Fortinet | 2019 | 61.4 | 342.5 | -32.0 |
| Arista Networks | 2020 | 87.7 | 769.5 | -15.6 |
| Costco | 2019 | 38.8 | 211.7 | -19.6 |
| Watsco | 2020 | 10.6 | 163.1 | -20.3 |
What kept us busy last year?
We invested in 10 new companies and sold 13 companies. An unusually busy period. Our approach is to experiment with a longer list at the tail of the portfolio while showing conviction in the top 20 companies. We try to be ruthless with this tail where conviction levels don’t go up or when better opportunities become available. Our long-term approach is best demonstrated in the top 10 of the portfolio. The average age of our top 10 holdings in the portfolio is 6 years16.
Let’s dive into a couple of our new investments.
Brown & Brown (B&B) is the sixth largest insurance intermediary in the US17 stewarded by the Brown family and based in Daytona Beach, Florida. B&B facilitates the purchase and administration of insurance mainly for small businesses who depend on intermediaries such as B&B to help them with understanding and insuring against complex risks. B&B does not take any balance sheet risk and collects a fee for its service. The key ingredients in their recipe is trust with customers, an ownership mindset and a culture of empowerment. A good example of “Keep it simple silly!”.
Hyatt Brown, the founder of the business, ran B&B for 49 years before handing over to Powell Brown. Powell Brown has upheld the culture that Hyatt carefully built while cultivating a strong ownership and customer first mindset. 60% of B&B staff are shareholders in the company and the family owns 15%18.
“When we put the customer first, we know with great confidence that it will all work out for Brown & Brown in the long run.”
– J Powell Brown19
Companies with such enduring cultural attributes have a high chance of success as B&B has demonstrated in the decades gone by.
| Brown & Brown Growth Compound Annual Growth Rates/avg (Return On Equity) |
3 year | 5 year | 10 year | 20 year | 30 year |
|---|---|---|---|---|---|
| Sales | 17% | 16% | 12% | 11% | 13% |
| Net Profits | 22% | 20% | 15% | 11% | 17% |
| Operating Cash Flow | 12% | 12% | 10% | 10% | 14% |
| Free Cash Flow | 17% | 15% | 11% | 11% | 14% |
| Return On Equity | 15% | 14% | 13% | 13% | 18% |
Such consistency is rare. B&B’s free cash flow exceeds reported profits in most years. And B&B has reinvested these cash flows to grow organically and to consolidate the industry through acquisitions. Technology-driven disruption remains a key risk for them.
Sysmex is a world leading medical diagnostics company. We reinvested last year after selling in 2021 due to expensive valuations. The family has handed the keys to a professional CEO, Kaoru Asanu, who intends to sharpen focus on growth and returns. Sysmex has been investing in new technologies and in new markets over the last decade. These investments should begin to pay off. We believe there is room for profit margins to expand and for revenues to grow faster in the coming years. Sysmex has also begun to commercialise its surgical robots in Japan. Success in this area can take growth and profits to a much higher orbit while diversifying cashflows. We believe, this opportunity is not priced into its current valuations. Regulatory headwinds in China remains a key risk for the company.
“I also think it is important to remain humble and embrace a spirit of challenge. One of the biggest risks is of becoming arrogant or falling into the “large-company trap” and adopting a silo mentality”20
– Kaoru Asano, CEO of Sysmex.
The company’s culture is in safe hands.
It was a busy period for sales as well. Most of our sales were due to expensive valuations. We were unable to build conviction in Samsung C&T - a holding company with large investments in Samsung Electronics and Samsung Biologics. We expected the discount to these assets narrowing over time. But we struggled with this thesis post further meetings with management. We bought and sold this investment within a few months. Selling OCBC Bank was a mistake. The company continues to benefit from a stable banking environment in Southeast Asia rewarding patient shareholders.
So what does the future look like?
Quality businesses shine when the top-down macro becomes more challenging. We continue to find many such opportunities. This keeps us excited and motivated. We were busy travelling to Europe, Japan, China, India, Brazil, US and Turkey to meet with companies last year. Many markets outside of the US are beginning to look reasonably valued. Managing Emerging Markets and Asia strategies alongside our worldwide strategy gives us a ringside view of opportunities in these regions. Roughly half of the portfolio is invested in companies listed outside of America. This should prove helpful if American Exceptionalism hits a few roadblocks.
Predicting near term macro is not our forte. We did not foresee Covid or the conflicts in Ukraine and the Middle East. But such events teach us valuable lessons and we carry those with us. Sticking to what we learnt from Covid - companies with high quality cultures and sound franchises manage uncertainty, volatility and complexity better than most. Such companies are rare. Our endeavour remains to find such businesses, buy them at reasonable prices and remain patiently invested.
Thank you for reading and entrusting your savings with Stewart Investors.
Feb 2025

Want to know more?
Important Information
This material is a financial promotion / marketing communication but is for general information purposes only. It does not constitute investment or financial advice and does not take into account any specific investment objectives, financial situation or needs. This is not an offer to provide asset management services, is not a recommendation or an offer or solicitation to buy, hold or sell any security or to execute any agreement for portfolio management or investment advisory services and this material has not been prepared in connection with any such offer. Before making any investment decision you should conduct your own due diligence and consider your individual investment needs, objectives and financial situation and read the relevant offering documents for details including the risk factors disclosure.
Any person who acts upon, or changes their investment position in reliance on, the information contained in these materials does so entirely at their own risk.
We have taken reasonable care to ensure that this material is accurate, current, and complete and fit for its intended purpose and audience as at the date of publication. No assurance is given or liability accepted regarding the accuracy, validity or completeness of this material.
To the extent this material contains any expression of opinion or forward-looking statements, such opinions and statements are based on assumptions, matters and sources believed to be true and reliable at the time of publication only. This material reflects the views of the individual writers only. Those views may change, may not prove to be valid and may not reflect the views of everyone at First Sentier Group.
Past performance is not indicative of future performance. All investment involves risks and the value of investments and the income from them may go down as well as up and you may not get back your original investment. Actual outcomes or results may differ materially from those discussed. Readers must not place undue reliance on forward-looking statements as there is no certainty that conditions current at the time of publication will continue.
References to specific securities (if any) are included for the purpose of illustration only and should not be construed as a recommendation to buy or sell the same. Any securities referenced may or may not form part of the holdings of First Sentier Group portfolios at a certain point in time, and the holdings may change over time.
References to comparative benchmarks or indices (if any) are for illustrative and comparison purposes only, may not be available for direct investment, are unmanaged, assume reinvestment of income, and have limitations when used for comparison or other purposes because they may have volatility, credit, or other material characteristics (such as number and types of securities) that are different from the funds managed by First Sentier Group.
Selling restrictions
Not all First Sentier Group products are available in all jurisdictions.
This material is neither directed at nor intended to be accessed by persons resident in, or citizens of any country, or types or categories of individual where to allow such access would be unlawful or where it would require any registration, filing, application for any licence or approval or other steps to be taken by First Sentier Group in order to comply with local laws or regulatory requirements in such country.
About First Sentier Group
References to ‘we’, ‘us’ or ‘our’ are references to First Sentier Group, a global asset management business which is ultimately owned by Mitsubishi UFJ Financial Group (MUFG). Certain of our investment teams operate under the trading names AlbaCore Capital Group, First Sentier Investors, FSSA Investment Managers, Stewart Investors and RQI Investors all of which are part of the First Sentier Group. RQI branded strategies, investment products and services are not available in Germany.
This material may not be copied or reproduced in whole or in part, and in any form or by any means circulated without the prior written consent of First Sentier Group.
We communicate and conduct business through different legal entities in different locations. This material is communicated in:
- Australia and New Zealand by First Sentier Investors (Australia) IM Ltd, authorised and regulated in Australia by the Australian Securities and Investments Commission (AFSL 289017; ABN 89 114 194311)
- European Economic Area by First Sentier Investors (Ireland) Limited, authorised and regulated in
- Ireland by the Central Bank of Ireland (CBI reg no. C182306; reg office 70 Sir John Rogerson’s Quay, Dublin 2, Ireland; reg company no. 629188)
- Hong Kong by First Sentier Investors (Hong Kong) Limited and has not been reviewed by the Securities & Futures Commission in Hong Kong. First Sentier Group, First Sentier Investors, FSSA Investment Managers, Stewart Investors, RQI Investors and Igneo Infrastructure Partners are the business names of First Sentier Investors (Hong Kong) Limited.
- Singapore by First Sentier Investors (Singapore) (reg company no. 196900420D) and this advertisement or material has not been reviewed by the Monetary Authority of Singapore. First Sentier Group (registration number 53507290B), First Sentier Investors (registration number 53236800B), FSSA Investment Managers (registration number 53314080C), Stewart Investors (registration number 53310114W), RQI Investors (registration number 53472532E) and Igneo Infrastructure Partners (registration number 53447928J) are the business names of First Sentier Investors (Singapore).
- United Kingdom by First Sentier Investors (UK) Funds Limited, authorised and regulated by the Financial Conduct Authority (reg. no. 2294743; reg office Finsbury Circus House, 15 Finsbury Circus, London EC2M 7EB)
- United States by First Sentier Investors (US) LLC, registered with the Securities Exchange Commission (SEC# 801-93167).
- other jurisdictions, where this document may lawfully be issued, by First Sentier Investors International IM Limited, authorised and regulated in the UK by the Financial Conduct Authority (FCA ref no. 122512; Registered office: 23 St. Andrew Square, Edinburgh, EH2 1BB; Company no. SC079063).
To the extent permitted by law, MUFG and its subsidiaries are not liable for any loss or damage as a result of reliance on any statement or information contained in this document. Neither MUFG nor any of its subsidiaries guarantee the performance of any investment products referred to in this document or the repayment of capital. Any investments referred to are not deposits or other liabilities of MUFG or its subsidiaries, and are subject to investment risk, including loss of income and capital invested.
© First Sentier Group
An affiliate of First Sentier Group
Copyright © 2026 Stewart Investors.